Tachography
Historical document, translated for reference. It reflects medical knowledge of the 1920s–30s and is not medical advice.
Summary
This article from the 1928–1936 Great Medical Encyclopedia describes historical graphical methods for recording blood flow velocity in blood vessels. It covers early devices such as the Chauveau-Lortet hemodromograph, Cybulski's photo-hemotachometer based on the Pitot tube, and von Kries's tachygraph.
Encyclopedia article (1928–1936)
TACHOGRAPHY (from the Greek tachys = fast and grapho = write), a graphical method for recording the velocity of fluid movement, used to determine fluctuations in blood flow velocity in blood vessels. Among many instruments designed for this purpose, the hemodromograph of Chauveau and Lortet must be placed in the foreground.
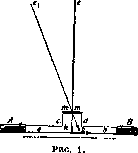
A small metal tube ab (Fig. 1) is equipped with a wide, short branch cd in the middle. The upper opening of this branch is covered by a tight rubber membrane mm, through the center of which passes a thin lever ke bearing a small flat disc k at its end. The lever is positioned such that the center of the disc stands perpendicular to the axis of tube ab. The apparatus, previously filled with blood or a physiological solution, is inserted into both ends (A and B) of a severed artery. The blood stream, encountering resistance at the disc k, deflects it in the direction of blood movement (Fig. 1, kfr); on the other hand, the elastic membrane tends to return the lever to its original position. As a result of these forces, oscillations of the lever occur, which can be recorded on a kymograph. For a correct evaluation of the results obtained in tachography, the recording of velocity oscillations—the tachogram—is usually conducted parallel to the blood pressure recording.
Figure 2 presents two graphs obtained in an experiment on blood velocity in the carotid artery of a horse. A comparison of both curves makes it obvious that this velocity is in direct dependence on the periodic work of the heart and that each change in blood pressure corresponds to a definite change in velocity. If the apparatus has been previously calibrated by passing a fluid through it at defined speeds, the resulting tachogram can be used to judge blood velocity and the character of its changes over a definite period. With the form of tachogram shown in Fig. 2, the magnitude of velocity at any given moment can be easily determined by the height of the corresponding ordinate.
In view of the fact that Chauveau's hemodromograph can be used only in experiments on large animals, attempts were made
to develop an instrument suitable for measuring velocity in vessels of smaller caliber as well. Utilizing the principle of the Pitot tube, Cybulski proposed a photo-hemotachometer, by means of which velocity oscillations are recorded on a photographic plate.


The essence of Cybulski's method consists in including in the fluid stream two tubes bent at right angles, with their open ends directed in opposite directions, as seen in Fig. 3. The fluid stream, encountering the opening c in its path, is arrested, and the velocity of its particles is reduced to zero. The kinetic energy of these particles acquires another form—pressure energy—causing the fluid level in manometer ca to rise. In manometer bd, facing in the opposite direction, the reverse phenomenon is observed: its level must drop somewhat due to the suction action of the stream, which tends to carry along particles located in limb d. In view of the fact that both pressure and suction action
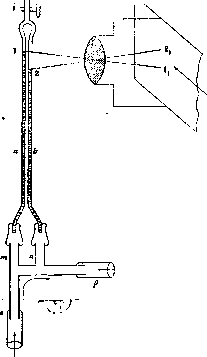
entirely depend on the velocity, it is understood that the difference in levels in both manometers will change parallel to the change in this velocity; in other words, this difference, with appropriate calibration, can serve as a measure of this velocity. Cybulski somewhat modified the form of the Pitot tube in his apparatus, which significantly facilitated both the manufacture of the receiving cannula and the methodology of the experiment itself. In its completed form (Fig. 4), the apparatus consists of two
parts: cannula cp and manometer ab with stopcock r. The end of cannula c is tied into the central, and p into the peripheral end of the severed artery, while branches m and n are connected by means of rubber tubes to the free ends of manometer ab, previously filled with a weakly colored fluid. Allowing the fluid to flow down to a certain height, stopcock r is closed, and by opening the clamp of the previously clamped artery, blood is let into the apparatus. Oscillations of levels 1 and 2 in both tubes are photographed (11 and 21) on a moving photographic plate. Figure 4 depicts Cybulski's apparatus with the scheme of its photographic setup.
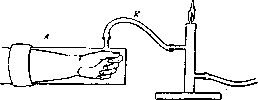
The principle of the design of von Kries's tachygraph is clear from Fig. 5. A plethysmograph (see Plethysmography) L is connected to a small gas burner. The increase in the volume of the hand, finger, etc., under the influence of the systolic blood pressure results in an increase of pressure in the plethysmograph, which is transmitted via rubber tube K to the burner and causes corresponding oscillations of the flame, which can also be recorded with the help of photography. The appearance of such a tachogram is depicted in Fig. 6.
The first tachometer was proposed by Karl Vierordt in 1858, but due to major design flaws, it did not find further application.
D. Romashov
Related articles
Cite this page
“Tachography.” Soviet Medical Encyclopedia. English translation of Bolshaya Meditsinskaya Entsiklopediya, 1st ed. (Moscow, 1928–1936), ed. N. A. Semashko. https://sovietmedicalencyclopedia.com/article/tachography/