Graphical Representations (GRAPHICAL REPRESENTATIONS)
Historical document, translated for reference. It reflects medical knowledge of the 1920s–30s and is not medical advice.
Summary
This article from the 1930s details the use of graphical representations in medicine, including anatomical diagrams, clinical charts, and physiological curves. It highlights their utility in documenting patient data, tracking health trends, and organizing military medical logistics.
Encyclopedia article (1928–1936)
GRAPHICAL REPRESENTATIONS.
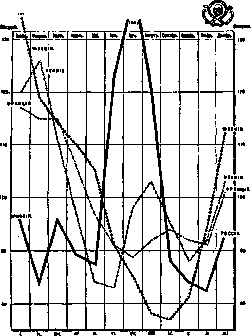
Figure 2.
with images of the human body (or individual parts of it), for example, with diagrams of the anterior, posterior, or lateral surface of the body, diagrams of the pelvis, etc., or with conventional graphic images in the form of, for example, visual field charts in ophthalmology (see Hemianopsia, Vol. VI, pp. 499-502), etc. On these diagrams, results of examinations are plotted with colored pencils or conventional signs, for example: boundaries of absolute and relative dullness, locations of pathological respiratory sounds, rales, changes in skin sensitivity (see Vol. II, pp. 109-111), etc. Similar diagrams are used in the 'personal sanitary-evacuation card of a casualty from combat operations' to allow for a quicker understanding of the localization of the injury. Similar graphical representations are used for visual topographic designation of certain locally applied physiotherapeutic measures, for example, to indicate the places of electrode application, etc. In biology and medicine, graphical representations in the form of diagrams are often used to clarify and reveal sometimes complex phenomena of heredity (see Hemophilia, Vol. VI, pp. 583-584). In addition to printed forms with various diagrams, usually encountered in special medical institutions, rubber stamps are often used, by means of which various diagrams of the arrangement of organs, etc., can be imprinted on any piece of paper (see Figure 4). Graphical representations are also curves of body temperature and curves of various physiological processes (pulse, respiration, etc.), and in the latter case, graphical representations are recorded by self-recording instruments (see Graphical method). For a comparative characterization of individual objects and phenomena, as well as individual individuals or collectives possessing diverse signs having diverse expression, recently in medicine, graphical representations in the form of profiles have been widely used, giving the possibility of simultaneous expression of various signs. Thus, anthropometric profiles, psychological profiles, etc., are well known. An example of a profile can be the psychophysiological profile shown in Fig. 3, used in the Red Army for the characterization and comparative evaluation of individual groups of recruits: a list of signs by which groups or individuals are compared is arranged horizontally, and the different degree of development of individual signs in different groups or in different individuals is noted vertically. As a result, a curve-profile is obtained, sharply different for different groups or individuals. Graphical representations in the form of so-called movement graphs (e.g., a train movement graph, etc.) are widely used. For doctors, this form of graphical representation is significant when compiling a schedule for the movement of military-sanitary trains or horse-drawn (or automobile) military-sanitary transport. An example of a movement graph can be Fig. 5, where time segments during which the transport movement occurs are plotted horizontally, and segments corresponding to sections of the evacuation route are plotted vertically. When connecting the points indicating the location of the transport at different moments, inclined lines are obtained for the time the transport is in transit and horizontal lines for
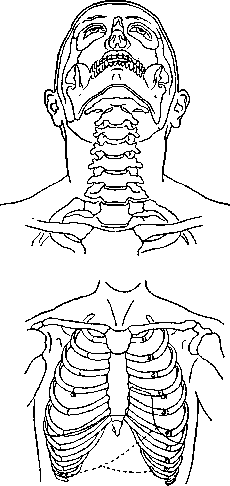
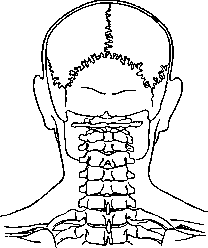
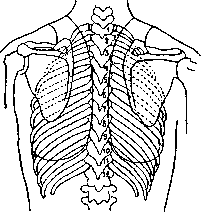
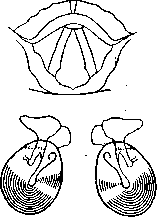
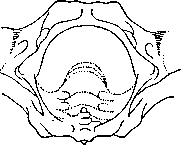
Figure 4. Samples of graphic stamps for clinical purposes.
the time of its stay at stops. Among the forms of graphical representations, acquaintance with which is necessary for a doctor, especially one coming into contact with resort affairs and climatology, a sanitary doctor, etc., so-called 'isocurves', or curves of constant value, are of great importance, for example, isotherms, i.e., imaginary lines connecting places with the same average temperature (see Figure 6), isohypses (lines connecting places having the same height above sea level, which is of great importance when compiling and reading topographic maps), isobars (imaginary lines connecting places having the same pressure), etc.
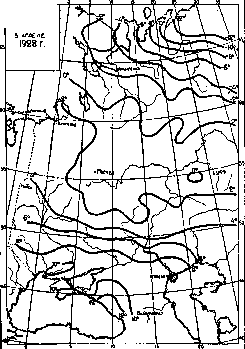
Figure 6. Isotherms.
Of course, the stated forms do not exhaust all forms of graphical representations. They are extremely diverse. The form of graphical representation is closely connected with the nature of the material. Therefore, 'it is completely incorrect to entrust the drafting of projects for graphs of statistical data to non-specialists in medicine—draftsmen and illustrators, because as a result of this, not to mention the incorrect methodology, template, soulless images are created, not at all reflecting the peculiarities of the numerical series on which they arise. By virtue of this, only the technical execution of projects, requiring not so much independent thinking as thoroughness and technical perfection, should be entrusted to auxiliary personnel' (Izle). In the practice of medical-sanitary work in the USSR, the use of graphical representations has received completely exceptional distribution, which is understandable if one takes into account the strongly increased interest in problems of public health, the coverage of all medical questions in a social context, the development of sanitary-educational work, etc. All this requires every medical worker to be familiar with the technique of making graphical representations.
Related articles
Cite this page
“Graphical Representations (GRAPHICAL REPRESENTATIONS).” Soviet Medical Encyclopedia. English translation of Bolshaya Meditsinskaya Entsiklopediya, 1st ed. (Moscow, 1928–1936), ed. N. A. Semashko. https://sovietmedicalencyclopedia.com/article/graphic-images/